Optimize system velocity using the
Flow Index Report
The Demand Driven Operating Model comes with a set of operational metrics, one of which is the Velocity. This metric refers to the speed at which materials and products move through the supply chain, facilitated by strategically placed inventory buffers.
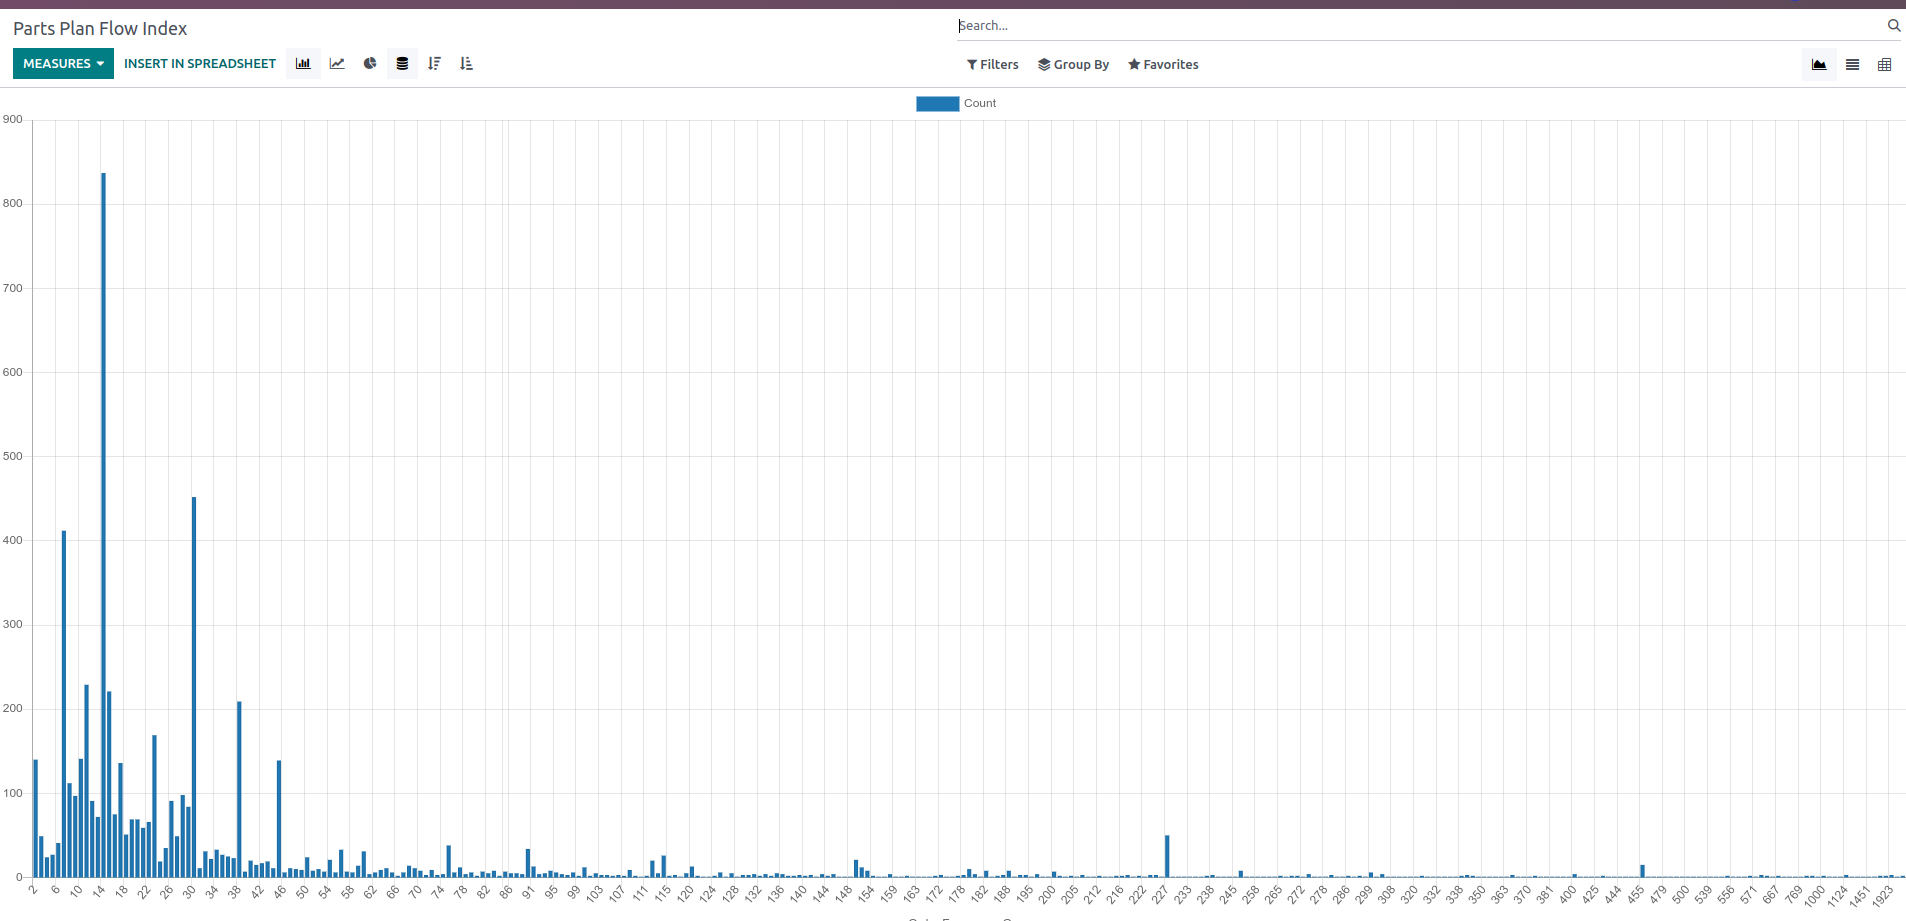
The Flow Index Report
This report helps to measure velocity at the decoupling points, by comparing the order frequency across multiple products. In the screenshot below you can see, in the horizontal axis, the order frequency in number of days, and in the vertical axis, the number of stock buffers that fall into each order frequency. Clicking on each of the bars will take you to the stock buffers falling in that category.
Understand the results
Rarely ordered
Products that fall into the high number of days of reordering frequency indicate that are rarely ordered. This may be due to a decreased popularity of the product, the use of too large minimum order quantities when reordering, reordering too infrequently, or a combination of those.
This translates into excess inventory that is not being used to protect the flow, and is becoming a liability to the organization, often ending up in inventory write-offs.
Those cases need to be analysed in detail. In some cases it may be beneficial to reduce the minimum order quantities or to increase the reorder cycle.
Too frequently ordered
Each time we reorder a product we incur in transactional costs associated with the actual purchase. Those costs can be administrative, excessive coordination efforts, transportation, inspections or quality assurance.
While reordering frequently has many benefits, such as reduced storage and reduced risk, it has to be weighted against the transactional costs.
Increasing the minimum order quantities or the reordering review cycle could be beneficial in those cases where the transactional costs outweigh the benefits of improved velocity.
Watch the report in action
Explore our related articles
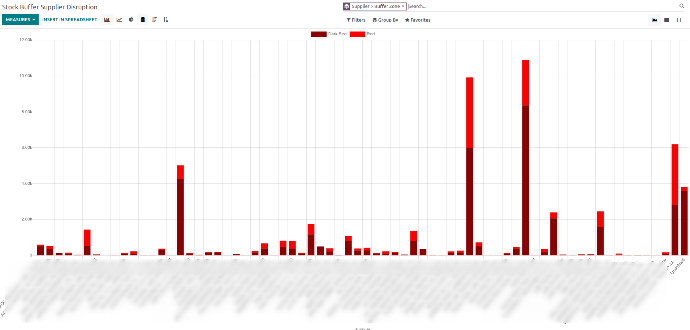
Improve supply reliability with the Supplier Disruption Report
This report evaluates supplier reliability by analyzing the time stock levels spend in critical buffer zones. Learn to identify unreliable suppliers and take corrective actions to maintain a steady flow of materials.
Discover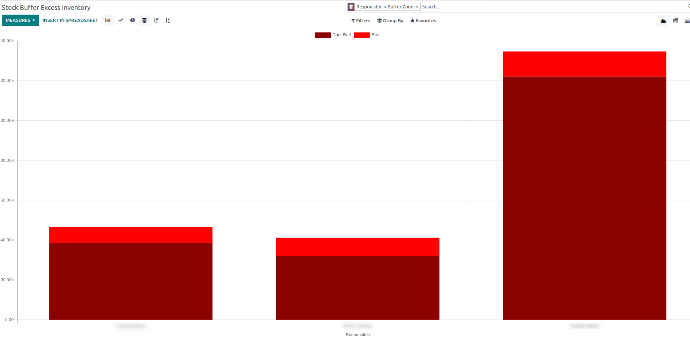
Evaluate stock managers reliability with the Excess Inventory Report
Use this report to evaluate the effectiveness in stock excess control. It analyzes the cost of excess inventory held, enabling comparisons with past periods to understand the evolution of the performance. This allows for a comprehensive understanding of inventory management efficiency.
Discover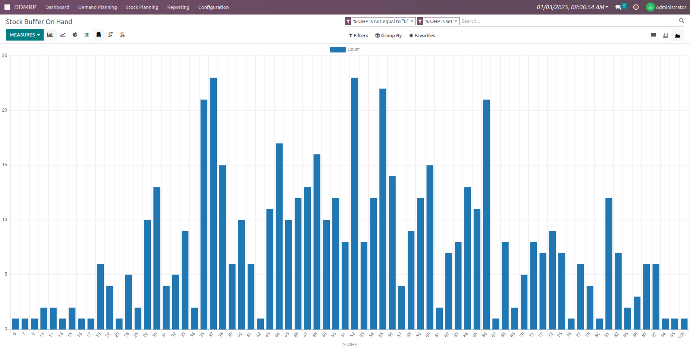
Assess inventory levels with the On-hand Distribution Report
This report shows the state of the inventories when compared to their respective optimal stock limit. This helps evaluate for which specific parts the company tends to hold too much stock and the overall inventory behavior of the company.
Discover
If you are willing to learn more, register to our
1-hour DDMRP Basic Training webinars.
Send us a message and our team will contact you with the available sessions: